| 번호 | 제목 | 날짜 |
|---|---|---|
| 4 | [SeekingAlpha] New Valuation Approach - PTR | 2017-10-31 |

Summary
A new approach to stock valuation looks at the relationship of the stock price to the value of the patent technology owned by the firm.
Simulations indicate that stocks with low price-to-technology ratios outperform the market.
Investors may wish to include PTR valuations as part of a stock-screening exercise.
A former student approached me with a new model for stock valuation that appears to have great promise. Wisdomain.com has a database with comprehensive information on patents which has been used by intellectual property professionals to manage technology. Recently, the company figured out a Price/Technology ratio that appears to be a powerful tool for screening technology investments.
PTR challenges the conventional principles of long-term value investing. It takes a completely objective approach to valuation through the mining of intellectual property big data and combining it with financial big data. It is an investment indicator that provides insights into the future performance of investments by identifying undervalued companies that possess patented technologies.
Because patent valuation is technology valuation, PTR uses a proprietary algorithm based on technology valuation and total market capitalization data to identify undervalued technology companies.
PTR = Market Capitalization
Σ (Total Value of Patents)
Σ (Total Value of Patents) = Total Technology Asset Value
Technology assets play a key role in facilitating the competitiveness of a company in most industries. Since the sum of the value of all of the patents owned by a company is a good proxy for the value of the technology assets owned, it can be considered to be tied to the future potential profitability of the company. Although the formula is similar to the P/E ratio in that the companies with relatively lower PTR values are considered to be the undervalued companies, it is also completely different.
Historical simulations of a PTR index formed by PTR funds comprised of the top 20 lowest PTR stocks exceed the NASDAQ’s average returns by 46.4% in the 1st year and 71.9% in the 2nd year. Similarly, the simulations show that the low PTR funds outperform the S&P 500 by 5.8% in the 1st month and 78.8% by the 2nd year. The PTR Index outperforms the market 100% of the time during the simulation period, and funds held over longer periods result in higher returns relative to the market.
(click to enlarge)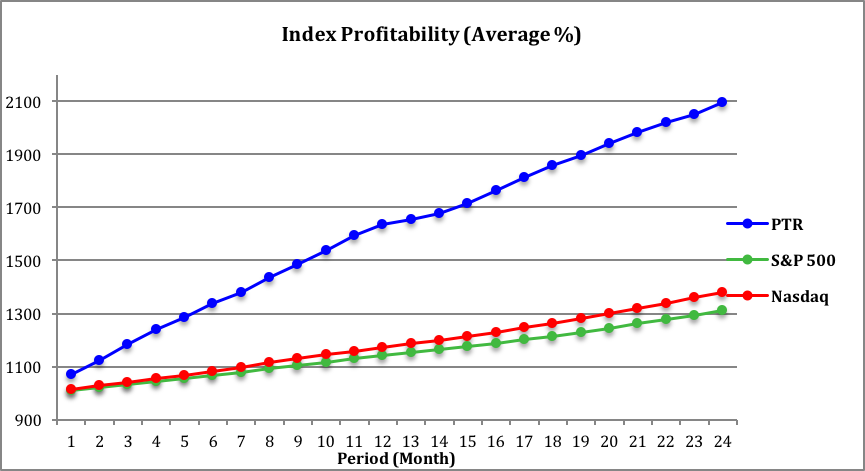
Simulation period = 2010-2015; PTR, NASDAQ, and S&P 500 values have been normalized to 1,000; Funds purchased on a daily basis over the course of the simulation period to minimize the effect of daily variations in stock prices and obtain the average performance values of the funds over the investment periods within the simulation period.
The PTR investment model shown above is based on long-term investments into funds comprised of 20 low PTR companies. There were individual cases among the 20 lowest PTR stocks where the stock demonstrated negative returns; however, funds created by combining the 20 lowest PTR stocks have been shown to deliver positive returns. Although investments into individual stocks with the lowest PTR values do not guarantee positive returns, the PTR as a stand-alone indicator has proven to be quite successful.
The top 15 companies with the lowest PTR values that are currently traded on the NASDAQ and NYSE are as follows. DMRC, ESIO, CKP, RIGL, IMMU, SNMX, UIS, ROVI, SGI, ARRY, OCLR, AMD, IMI, XNPT and HTCH.
(click to enlarge)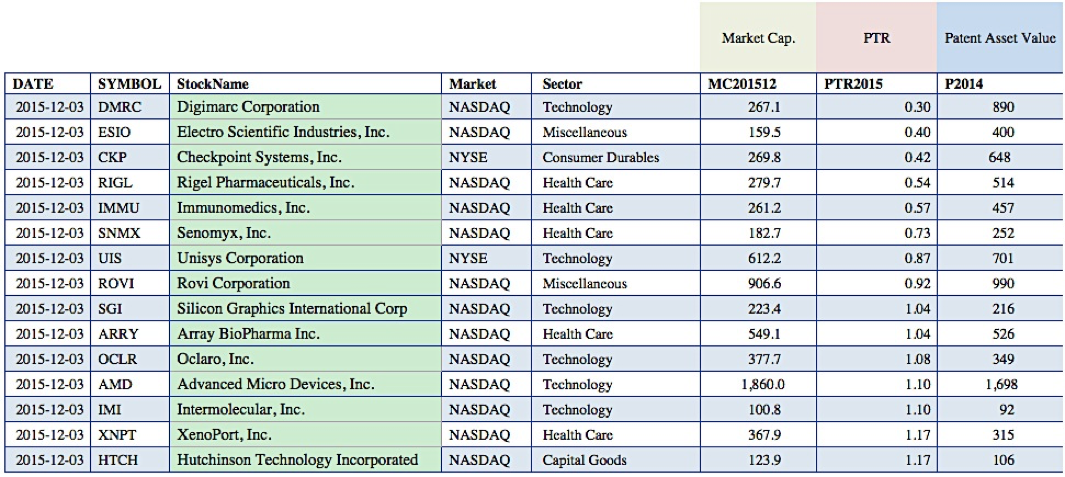
Although the simulations above demonstrate that the PTR is a breakthrough investment indicator for technology-driven companies, analysts are still in the early stages of developing the methodologies to maximize profitability through the application of the PTR. Some interesting findings to date have shown that the PTR stocks in the smaller market capitalization categories demonstrate better performance relative to PTR stocks in the larger market capitalization categories. With this level of performance, it will be interesting to see what else the PTR has in store for us.